A reminder for those joining our program already in progress: scope insensitivity means that people are willing to give the same about to solve a program almost no matter how big it is.
Part of this is likely that humans don’t reckon big numbers well. After all, in our salad days, we needed to figure out how many animals were nearby and how many people were in our group, but we didn’t need to count the stars or, God help us, remember how many zeros are in a petabyte (answer: a lot).
Which leads us to have troubles with numbers like this:
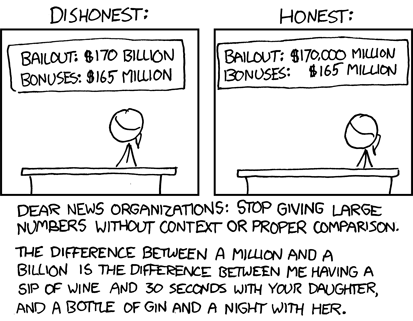
Thanks to xkcd for the illustration.
So how do you make large numbers comprehensible to your target audience? In a great piece on Gizmodo, mathematician Spencer Greenberg covered some important ways to anything over a thousand into perspective. His tips include:
Breaking the number down. When MADD talks about the cost of drunk driving, the amount talked about is usually not the billions of dollars; it’s $500 for every adult in the United States. Everyone can picture $500 or what they could buy with it, whereas we don’t know where to start with a billion dollars.
Actually, we do — with a vintage battleship gray Aston Martin DB5 — but that’s only a start.
Change the unit of measurement. The example he gives in the article is when talking about the deepest point in the ocean, don’t say 36,000 feet; say almost seven miles. I would argue that for nonprofits, you may want to change the type of unit of measurement. When doing earthquake relief, 8.4 on the Richter scale may not mean much. But “I saw a sign that talked about the building being earthquake-proof buried under a pile of rubble” gives someone an idea for the force we are talking about. Or 8.4 can be “the same force as the largest nuclear weapon ever tested.”
Batching the numbers. We can’t picture 2.3 million people. But we can picture the football stadium we saw on TV last night. So “every NFL stadium filled to capacity at once” gets the message across.
Incorporate time. In the article, he mentions that during the Battle of Stalingrad, Russians broadcast the message that “every seven seconds, a German soldier dies in Russia.” That gets the message across (that message being “RUN!!!”) in a way that 388,000 people dying each month does not.
These are some good tips. I would add another — infographics. For the modern nonprofit, an infographic can explain in a way that simple numbers can not. There is a strong article in this month’s Bulletin of the Association for Information Sciences and Technology (get it on any quality newsstand today!) that highlights tips for creating a good infographic.
They include:
- Identify a meaningful comparison for your audience. It has to be something that resonates with your audience, not just you.
- Tell your audience what you want them to do or think. Like all things, we want to begin with the desired action in mind.
- Don’t crowd your message with less important numbers or statistics.
There are some good nonprofit examples in the article, so I recommend a read. Hopefully, you can now get your millions and billions down to something that people feel like they can do something about.

